Ew(Hα) of one star forming galaxy in LAMOST survey
跳到导航
跳到搜索
Equivalent Width : EW(Hα)
Recall EW(Hα) measures the relative strength of Hα to the continuum under the line It therefore acts like a long baseline color index UV(Hα)<--> λ6550 A
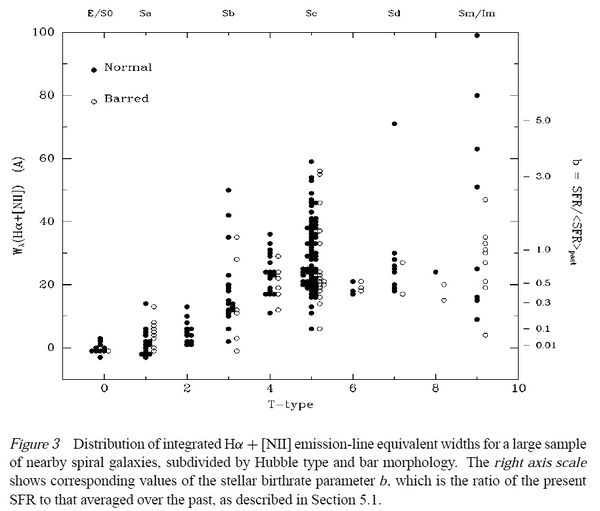
Although it cannot be converted to a current SFR, it has another important use : It measures the ratio of the current SFR (from Hα) to the integrated past SF (from the continuum) Using synthesis models, this relation can be quantified, to give : EW(Hα)--> (current SFR) / (mean past SFR) ; written SFR/<SFR> or "b" http://www.astro.virginia.edu/class/whittle/astr553/Topic11/Lecture_11.html
Exercise: measure the Ew(Hα) of one SFing galaxy in the LAMOST survey
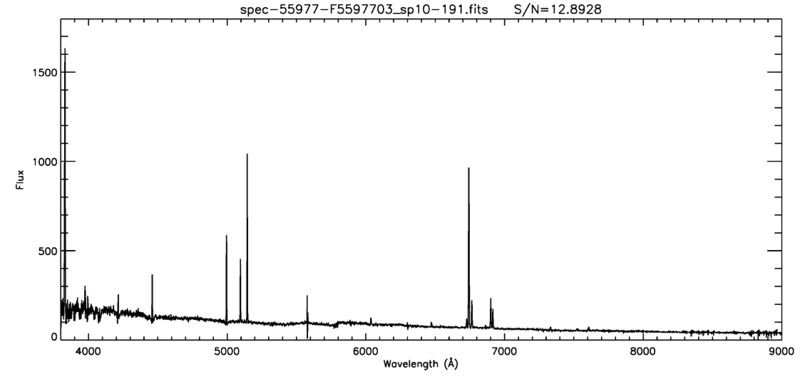
- RA=169.02567, DEC=4.79585, z=0.02729, S/N=12.89
SDSS image
http://skyserver.sdss3.org/dr10/en/tools/explore/summary.aspx?id=1237654605329661983&spec=0&apid=#imaging
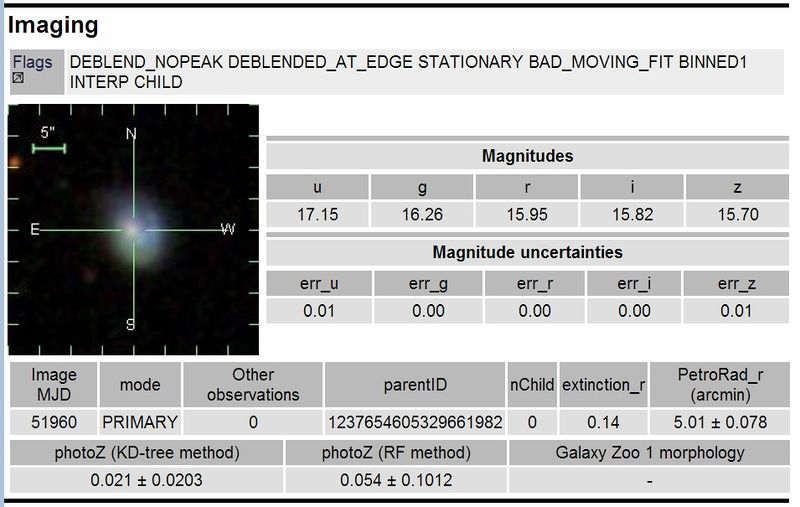
- A blue, compact, normal galaxy
- blue:
- within R_50: ⟨μ_50,g⟩=20.1374, ⟨μ_50,r⟩=19.7729 → ⟨μ_50,g⟩ - ⟨μ_50,r⟩ =0.36 < 0.43
- within R_90: ⟨μ_90,g⟩=21.1151, ⟨μ_90,r⟩=20.8108 → ⟨μ_90,g⟩ - ⟨μ_90,r⟩ =0.30 < 0.43
- compact:
- within R_50: 21.83-0.47(⟨μ_50,g⟩ - ⟨μ_50,r⟩) =21.66 > ⟨μ_50,g⟩
- within R_50: 21.83-0.47(⟨μ_90,g⟩ - ⟨μ_90,r⟩) =21.69 > ⟨μ_90,g⟩
- not dwarf:
- z=0.02729 → D=119 Mpc → M_g= -19.1277, M_r= -19.4277 → M_g < -19.12+1.82(M_g-M_r)= -18.6040
- blue:
Lamost sepctrum
- Calculation of the Ew(Hα)
- ignore the stellar absorption (usually ~2A) and the dust distinction
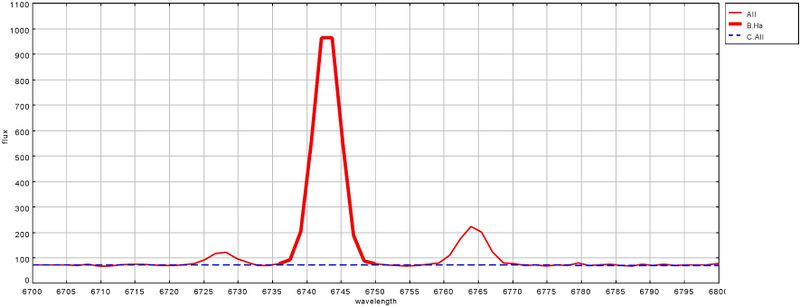
- central wavelength of this galaxy: 6563*(1+z)=6742 A
- continuum (blue dashed line): linear fit of the wavelength range [6650,6850] (masked the emission line region [6710,6780])
- Ha emission (thick red solid line)
- Ew(Hα)=area (between thick red line and blue dashed line)/strength of continuum = 67.95A
- From the Fig.3 of Kennicutt (1998, ARA&A, 36,189), it implies that the b= SFR/<SFR> is larger than 5
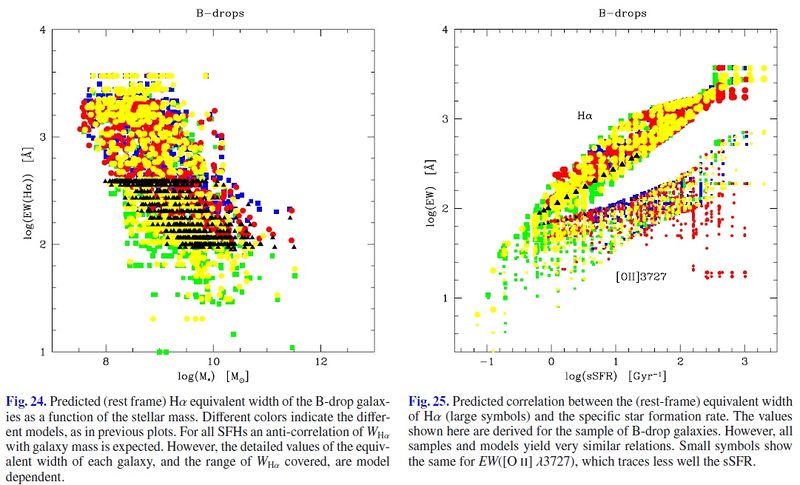
- Schaerer et al. (2013, A&A, 549, A4): Properties of z ∼ 3–6 Lyman break galaxies I. Testing star formation histories and the SFR-mass relation with ALMA and near-IR spectroscop
