Difference between revisions of "Research highlights"
| Line 25: | Line 25: | ||
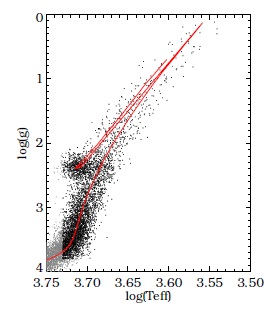
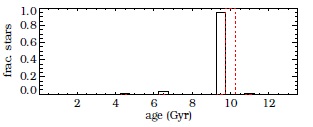
If we want to dissect the formation history of the Galaxy, we ideally need to know the ages of the stars we are studying. Ages are notoriously difficult to determine, but with precise stellar parameters from high-resolution spectroscopic surveys, such as APOGEE, this is becoming possible. SHAO postdoc Emma Small is working on developing tools to estimate ages for red giant and red clump stars (Fig. D3). The resulting catalogues, which combine ages with the detailed kinematics and chemistry, will allow us to probe the formation histories of the disc, bulge and halo. | If we want to dissect the formation history of the Galaxy, we ideally need to know the ages of the stars we are studying. Ages are notoriously difficult to determine, but with precise stellar parameters from high-resolution spectroscopic surveys, such as APOGEE, this is becoming possible. SHAO postdoc Emma Small is working on developing tools to estimate ages for red giant and red clump stars (Fig. D3). The resulting catalogues, which combine ages with the detailed kinematics and chemistry, will allow us to probe the formation histories of the disc, bulge and halo. | ||
[[file:Age1.jpg|left|400px|Age1]][[file:Age2.jpg| | [[file:Age1.jpg|left|400px|Age1]][[file:Age2.jpg|right|400px|Age2]] | ||
Figure 3. This figure demonstrates how we are determining star formation histories from spectroscopic surveys such as LAMOST or APOGEE (Small et al., in prep). We have generated a mock population of stars (left) with measured stellar parameters (e.g. gravity, temperature, metallicity), and used these to recover the underlying star formation history (right; red shows the input history, black shows the recovered one). | Figure 3. This figure demonstrates how we are determining star formation histories from spectroscopic surveys such as LAMOST or APOGEE (Small et al., in prep). We have generated a mock population of stars (left) with measured stellar parameters (e.g. gravity, temperature, metallicity), and used these to recover the underlying star formation history (right; red shows the input history, black shows the recovered one). | ||
Revision as of 09:00, 9 September 2014
Chemical evolution model of the MW, M31, nearby spirals and the local spiral population
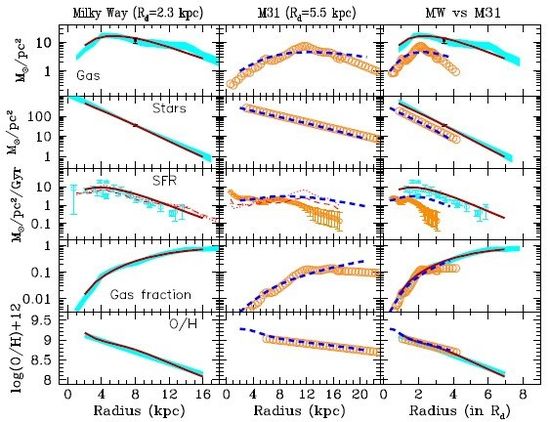
Based on our pioneer chemical evolution model of the Milk Way(Chang et al. 1999, Hou et al. 2000), we further studied and compared the chemical evolution of the disks of the Milky Way (MW) and of Andromeda (M31), in order to reveal common points and differences between the two major galaxies of the Local group. We use a large set of observational data for M31, including recent observations of the Star Formation Rate (SFR) and gas profiles, as well as stellar metallicity distributions along its disk. We show that, when expressed in terms of the corresponding disk scale lengths, the observed radial profiles of MW and M31 exhibit interesting similarities, suggesting the possibility of a description within a common framework. We find that the profiles of stars, gas fraction and metallicity of the two galaxies, as well as most of their global properties, are well described by our model, provided the star formation efficiency in M31 disk is twice as large as in the MW(Fig D1, Yin et al. 2009). Our chemical model has been successfully applied to the other individual local spirals, e.g. M33(Kang et al. 2012), UGC8802(Chang et al. 2012). Moreover, we further developed and applied this model to the whole local spiral populations (Chang et al.) and also embedded it in the semi-analytic models (SAMs) of galaxy formation and evolution(e.g, Fu et al. 2012, 2013).
Figure 1. Current profiles of gas, stars, SFR, gas fraction, and oxygen abundance for MW and M31. Observations are presented as shaded areas and model results by solid (for the MW) and dashed (for M31) curves, respectively.
Discovers and insights from LAMOST
Hyper-velocity starts (HVSs)
HVs are useful probes of both the Milky Way potential and of stellar populations in the inner galaxy. Identifying HVSs requires large spectroscopic surveys such as LAMOST or SDSS. The first bona-fide HVS was identified by Zheng Zheng from Utah (Zheng et al. 2014), but we are carrying out complimentary studies at SHAO. Nearby HVS will be particularly valuable as we can accurately determine their full three dimensional positions and velocities, hence allowing us to constrain the Milky Way potential. Zhong et al. (2014) have discovered a number of nearby high velocity stars, some of which appear to have velocities in excess of the local escape speed. A complimentary study was carried out by visiting student John Vickers (ARI, Heidelberg, Germany); while at SHAO he worked in collaboration with Martin Smith on a project analysing candidate HVSs from SDSS. The resulting paper (Vickers et al. 2014) presents both HVS candidates and also Hills candidates, i.e. metal-rich HVS stars which have orbits consistent with Galactic centre ejection. Work in this field is continuing at SHAO, with Martin Smith and student Yanqiong Zhang who are now looking for further Hills candidates in SDSS by combining high-precision proper motions from Stripe 82 (Bramich et al. 2008) with new spectroscopy from the 200inch telescope at Palomar.
Milky Way halo
LAMOST is also a valuable resource for studying the stellar halo. Using samples of spectroscopically identified K-giants (Liu et al. 2014) or M-giants (Zhong et al., in prep), we are able to trace the Sagittarius tidal stream across large areas of sky. Importantly, the coverage of LAMOST is significantly larger than SDSS, enabling us to trace the stream in previously unexplored regions such as at low latitudes (Li et al., in prep; see Fig D2). Deep photometric surveys are also important for studying halo substructures. Together with Jundan Nie at NAOC, Martin Smith is using the Chinese u-band SCUSS survey to look at the outer halo using blue horizontal branch stars. For the first time we are able to constrain the spatial extent of the Pisces over-density (Nie, Smith, et al., in prep), finding that it covers a huge area on the sky.
Figure 2. Sagittarius stream debris observed from LAMOST using M-giants (Li et al., in prep). The tails are seen extending from the core of the Sagittarius dwarf (located at RA = 280 deg, Dec = -30 deg) and can be traced around the entire sky.
Milky Way disk
The Milky Way’s disc also can also tell us about the evolution of our galaxy. Kinematic substructures in the outer disc have recently been found (Liu et al. 2012), but the origin remains unknown. Together with Juntai Shen, Martin Smith and his student Matthew Molloy (PKU) are investigating the predictions of an N-body simulation (Shen et al. 2010) in order to understand the mechanisms which can cause such substructures. Molloy et al. (2014) shows that such signatures can arise when stars fall into resonance with the Milky Way’s bar, leading to transient features in the outer disc. This scenario makes predictions which will be tested further using surveys such as LAMOST or APOGEE.
Ages of stars
If we want to dissect the formation history of the Galaxy, we ideally need to know the ages of the stars we are studying. Ages are notoriously difficult to determine, but with precise stellar parameters from high-resolution spectroscopic surveys, such as APOGEE, this is becoming possible. SHAO postdoc Emma Small is working on developing tools to estimate ages for red giant and red clump stars (Fig. D3). The resulting catalogues, which combine ages with the detailed kinematics and chemistry, will allow us to probe the formation histories of the disc, bulge and halo.
Figure 3. This figure demonstrates how we are determining star formation histories from spectroscopic surveys such as LAMOST or APOGEE (Small et al., in prep). We have generated a mock population of stars (left) with measured stellar parameters (e.g. gravity, temperature, metallicity), and used these to recover the underlying star formation history (right; red shows the input history, black shows the recovered one).


